- 1
Start at the hub
Active offices and leases, expiring terms, overdue notices and tickets, HVAC due — each a link into the work rather than a number to admire.
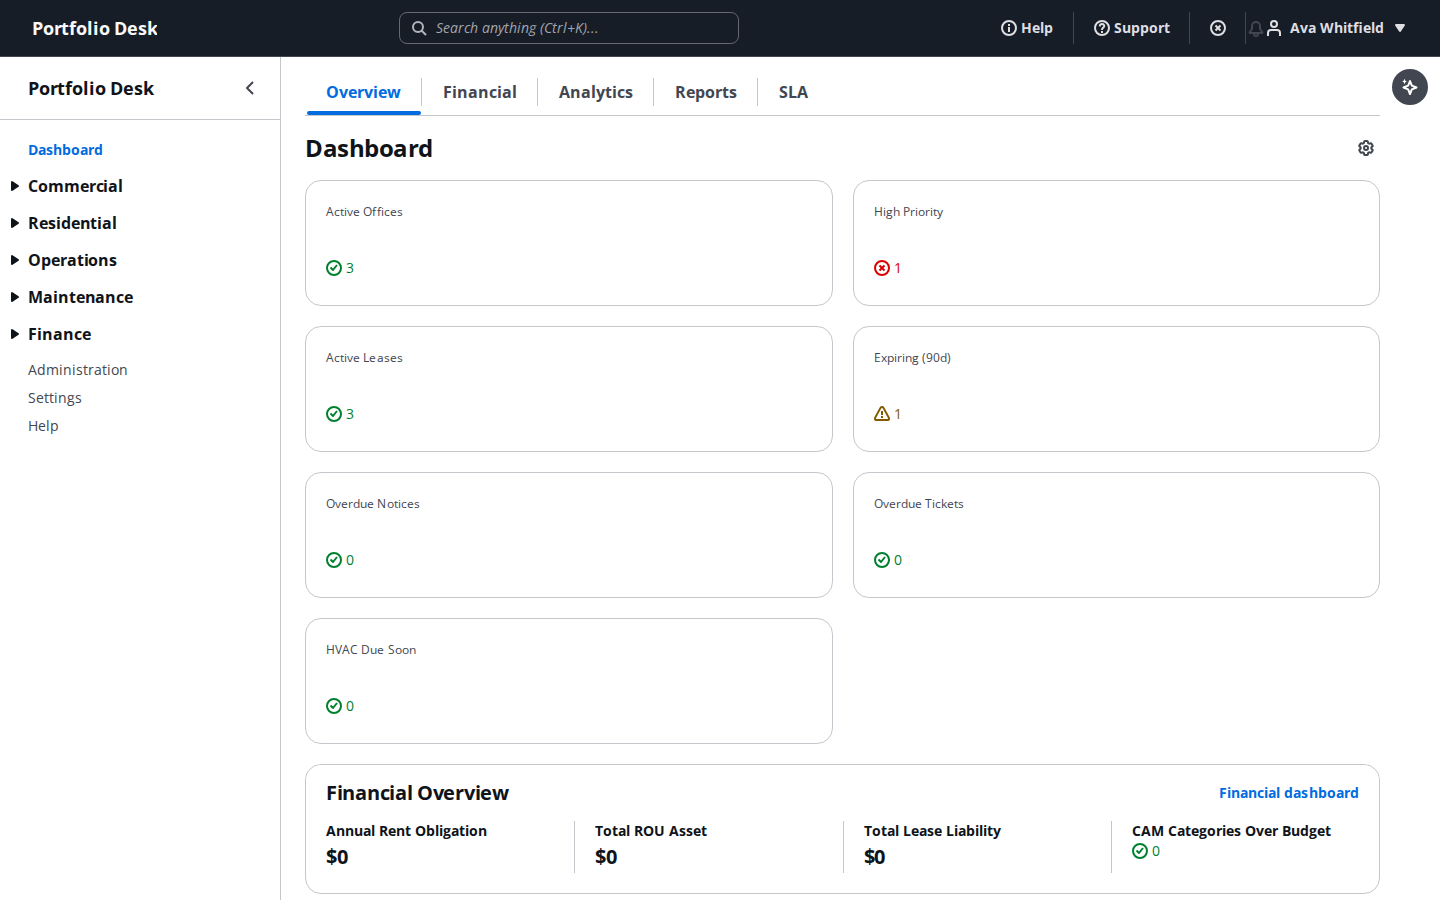
A real screen from the running product, captured against a demo portfolio. - 2
Look at the trends
Ticket volume and resolution, cost per square foot, space utilisation, portfolio health and lease risk over time.
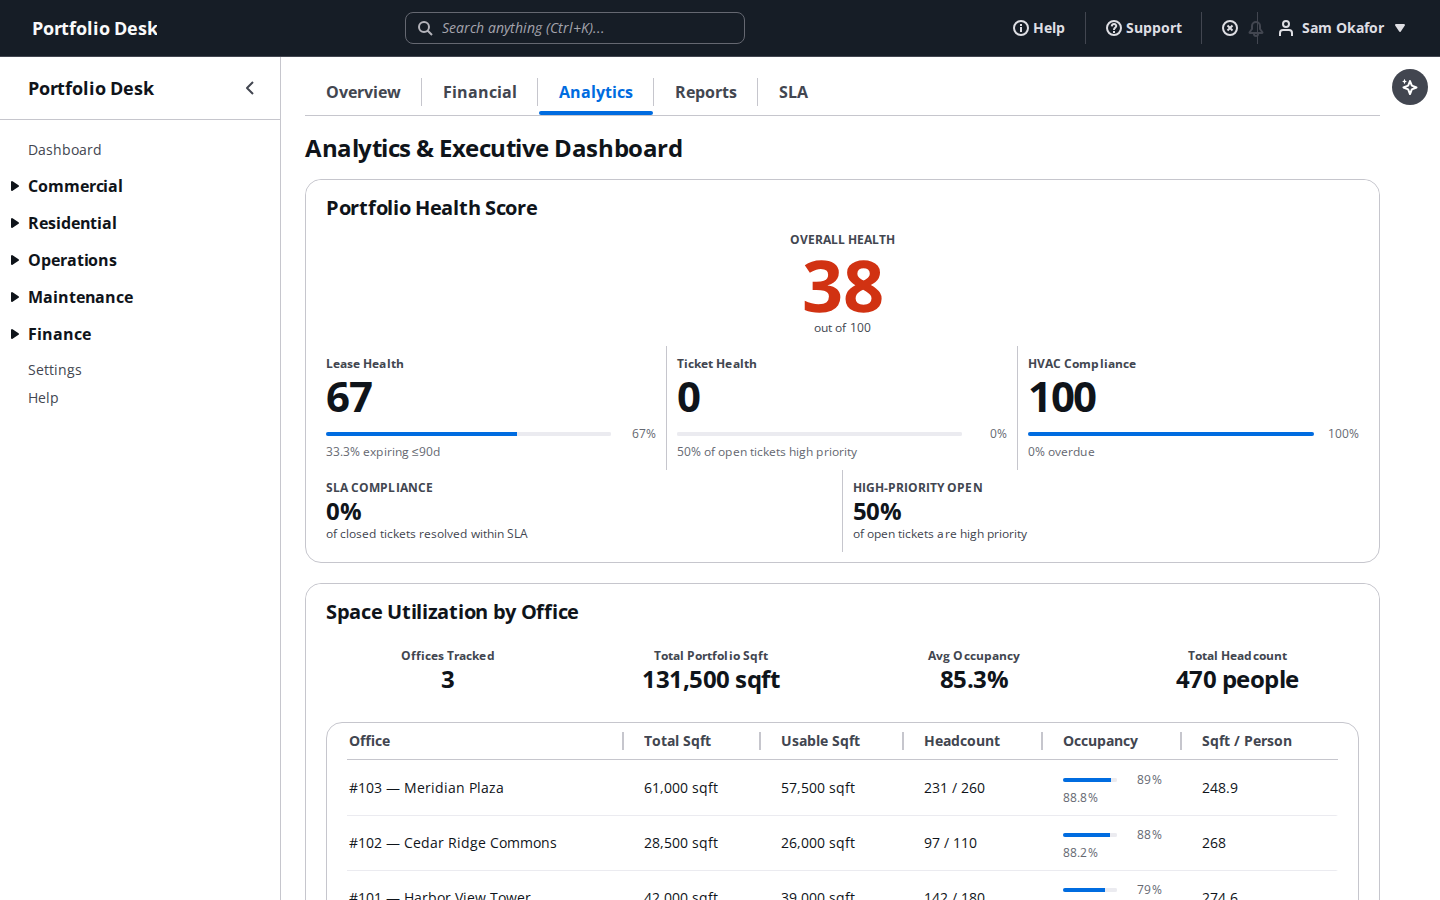
A real screen from the running product, captured against a demo portfolio.
Used alongside
Ready to try it?
Start your free 14-day trial
No card required. Every feature in this guide is available to try.
Get started